Slow websites are bad for everyone. They're bad for users as they waste their time (and also often bandwidth) unnecessarily; they're bad for business as they hurt SEO performance and increase bounce-rates; and they're bad for the environment as they waste electricity. Speeding up slow websites is an entire discipline unto itself, but this post aims to provide a basic introduction to pageload optimizations for those who have yet to research deeply into the subject.
A basic understanding of HTML, CSS and JavaScript will be required.
Measurement
Before we begin trying to improve our website's load speed, we need to measure what it is currently, in order to establish a baseline to compare any changes against - after all, there is is no point making a change to improve performance if it ends up having the opposite effect. An intuitive measurement to take would be the number of seconds it takes between a user visiting a URL, and everything on the page being displayed; any reduction in which would be considered an improvement.
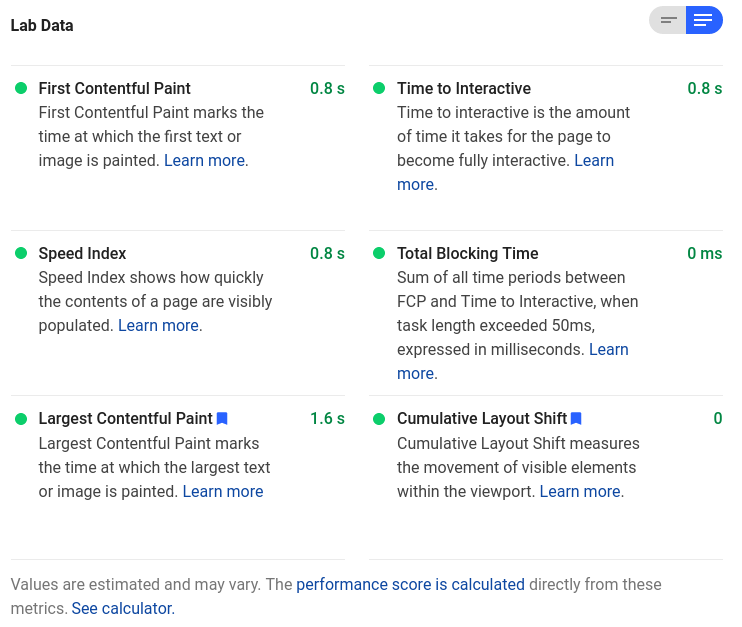
There are many tools available to measure load time on a website, one of the most widely used of which is Google's PageSpeed Insights, which uses the Lighthouse project for measurement. If you input your website's URL into PageSpeed Insights and hit the Analyse button, you should see an overall score between 0 - 100, where 0 is the worst possible score, and 100 the best. Underneath this there is a lab data section which shows several other metrics, measured in seconds (the lower the better).
Pagespeed Insights score for Pinopticon.net at time of writing.
Pagespeed Insights lab data for Pinopticon.net at time of writing.
The reason for multiple metrics is because pages do not display suddenly all at once. If you have ever watched a page load over a slow internet connection, you will have noticed that there is quite a long gap between the page starting to display on your screen, and it finishing. Generally, text will display first, and then larger content such as images and videos will appear as they are downloaded. While having the text display almost instantaneously is desirable, the page will still feel slow to users if it takes another 10 seconds for all of the images to finish loading.
As a result of this, Lighthouse measures several different metrics, each of which corresponds to a different stage in the pageload process, and then calculates the overall score from these. While it is useful to see which parts of the pageload process are taking the longest when doing micro-level optimisations, for the purposes of this introductory article we will just focus on increasing the overall score. Each of the individual metrics are interlinked, and improvement to one will generally benefit the others.
The critical rendering path
In order to display a page as quickly as possible to visitors, we need to minimise the amount of time it takes the browser to download and process the page before it can display it. The process the browser needs to go through in order to do this is complex and involves multiple different steps, which are collectively referred to as the Critical Rendering Path. The Critical Rendering Path can be seen as a timeline, with the first request for the page at the start, and the first pixels being displayed on-screen at the end. The shorter we can make this timeline, therefore, the faster the page will display for users.
Before the browser can display a page on-screen (known as painting), it must first know not only the content of the page, but also how that content should be styled. The combination of the two is know as the Render Tree, which is built from both the DOM (the browser's internal model of all the page's content, built from the page html and any js changes), and the CSSOM (the browser's internal model of all the page's styling, built from all stylesheets referenced from the page, and also js changes). To start painting the page, the Render Tree must be complete.
When a browser requests a page from a server it is sent the response back as a HTML file. The browser then starts parsing that HTML file and converting it into the DOM (checking it for errors and converting it into a form which can be stored in memory) . Any style tags that it encounters while parsing trigger additional requests for CSS files, which are then incorporated into the CSSOM. Because JavaScript can make changes to html, any JavaScript files that are encountered must also be downloaded and processed before the browser can continue parsing the html (a process known as blocking) as the JavaScript could possibly alter the html that comes after it.
Each additional resource, therefore, slows down the page rendering in two ways: the time it takes to download, and the time it takes to process.
Download times
Each return trip to the server takes time, both negotiating the connection, and downloading the response. The more of these there are, and the bigger the response for each, the longer it will take to finish constructing the Render Tree and start painting the page. The fewer resources on a page, therefore, and the smaller their size, the faster the page will load.
Removing unused resources
A first step to reducing the total filesize of a page is to remove any unused resources. If you are using any kind of framework (such as bootsrap, bulma etc.) there is a high chance that much of the CSS and JS that visitors need to download is unused on the page. As exemplified by the bootstrap components list, frameworks generally try to cater for many different use cases; this means the sheer number of different components they provide can be used on a wide variety of sites, but no single one will use every component on the list.
Many frameworks provide individual files for each component, in addition to the combined single CSS and JS files. If you use a CSS pre-processor (such as LESS or SASS), or an asset bundler (such as Webpack), you can use these individual files to build combined assets that contain only the parts of the framework that you actually use. Alternatively, if you are only using a few componenets, you could load each one of them individually in separate script and link tags.
Sites generally grow and evolve over time, with elements being replaced and upgraded. As well as pruning down framework size, it is also worth checking for any resources referenced in the page which are no longer used. Old tracking scripts or styling for old adverts can add significantly to total page size, even if they are no longer being used. I have even worked on sites in the past that changed framework during a re-design, but still referenced the old framework in the document head.
Removing unused resources can easily cut the total page weight down by hundereds of kilobytes, and on more than one occasion I have increased a site's lighthouse score by more than 20 points, just from removing assets that were invisible to visitors.
Self-host as many resources as possible
If you are using someone else's code, whether a framework or just a lightbox script, there's a good chance you may be serving it from their domain. An example of this is serving jQuery from the StackPath CDN, like so: <script src="https://code.jquery.com/jquery-3.6.0.min.js"></script>. Each additional domain you serve resources from will slow down page load time. This is due to extra round trips and SSL negotiations. To download a web page, a visitor's browser will have already established a secure connection with your site, if it encounters a resource from another domain, it will have to establish another connection before it can start downloading that resource.
Simply downloading all the external resources referenced in the page, and uploading them to your own server can make a big difference to page load time; just don't forget to update all script and link tags to point to the new location. This does add an additional maintenance burden to your own site, but the results are generally well worth it, and can cut whole seconds off the load time in some cases.
Combine smaller resources
As each request for a resource adds an additional roundtrip to the server, combining smaller files into one can also reduce pageload time. This can be either combining stylesheets, scripts, or creating spritesheets etc. There are also tools (such as webpack) that can automate this to a certain extent.
Combining resources can have a downside, however, as browser's normally cache resources for repeat visits. If any part of a combined file changes, the browser will have to re-download the whole file. Testing here is essential, but combining assets is well worth exploring.
Optimise Assets
A final step in reducing the download size of your page it to optimise assets. Generally, images are one of the worst offendors of being larger than they need to be. Optimizing images is a large topic all to itself, but try to ensure the images you use on the page are no bigger than they have to be (don't upload a photo straight from a phone or camera before resizing it), and have a reasonable level of compression.
Text assets like CSS and JS can also be minified to remove any whitespace, which will help cut-down on transfer sizes.
Parsing time
With most pages the time it takes to download resources will be the main contributor to the length of the Critical Rendering Path. Parsing those resources, however, does take time and if the user's device is low-powered, or a page makes heavy use of javascript, this can be far from inconsequential.
The general rule of thumb here is to make things as simple as possible. Avoid JavaScript if the same thing can be accomplished with standard HTMl elements (this will also help accessibility and general maintenance); ensure CSS selectors remain short; and reduce the HTML complexity wherever possible. Parsing HTML and CSS is normally very fast, but this:
<div class="alert alert-danger" role="alert">
  A simple danger alert—check it out!
</div>
In conclusion
Optimizing pageload speed is a complex topic, and most things are interelated, with a change in one having a knock on effect on another. Measurement is essential to ensure that any changes you make are having their desired effects. Having said that, if you keep the principles of KISS in mind (Keep It Simple Stupid), you are unlikely to go far wrong: remove all unused resources, make sure as much as possible is being served over your own domain; and optimize what you do need to serve to make it as small as possible.
This post aimed to be a high-level introduction to the topic, and there is much, much more you can learn. I have included a list of useful resources below if you want to continue your own research. Any feedback is also greatly appreciated, so if you found things difficult to understand, or think I missed something please tell me so I can improve this.
Further reading
Google's Web Fundamentals covers performance, amongst other things.