You may remember that last year I discovered the official website of the COP26 climate summit had some of the highest carbon emissions I'd seen to date. After I got in-touch with the organisers of the summit, they slowly improved the performance of the website over the course of a week, and managed to reduce the emissions to around half of what they were previously; when they'd finished making improvements the site's environmental impact was still well above average, but wasn't the high outlier it had been before.
Frustrated at the apparent hypocrisy in how little attention had been paid to making a fast and low-impact website, I even made my own low-emissions alternative over the course of a weekend.
Now that a year has passed, and the next Conference of the Parties to the United Nations Framework Convention on Climate Change has started, I was interested to see whether the COP27 website would pay more attention to digital sustainability than it's predecessor. The first signs, however, were troubling: I was met with a blank white screen.
https://cop27.eg/#/ with javascript disabled.
That's right, https://cop27.eg/#/ doesn't render any content unless javascript is enabled and working; something that can not be taken for granted - as there are a myriad of reasons why a javascript file may not make it to it's intended destination, beyond a user simply having it disabled - but is, unfortunately, becoming increasingly common. It also adds an empty fragment identifier to the url, for some reason.
Enabling javascript suddenly revealed the page, but I was no longer hopeful of the results of further testing. In the intervening 12 months since the last COP summit, the website carbon calculator has refreshed their metrics to reflect the increased efficiency of data transfer and the rising percentage of electricity from renewable sources. As a result of this, we can't draw a direct comparison between the two websites, however the results were quite amazing.
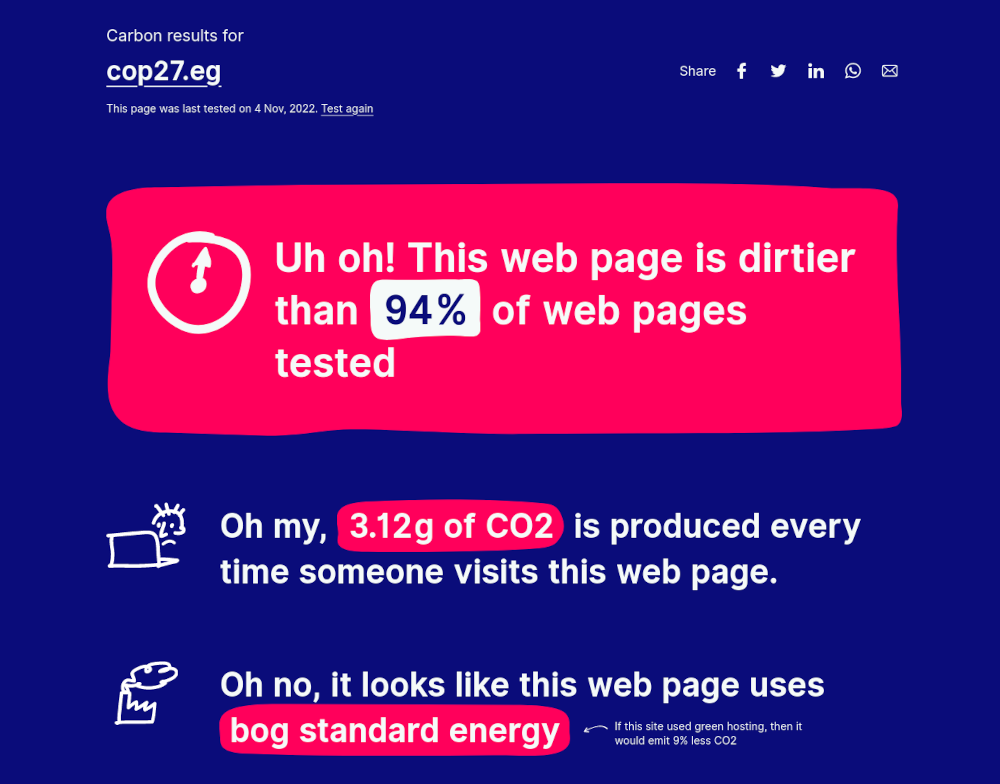
Carbon results for https://cop27.eg/#/ on .
The absolute emissions for the COP27 website reflect the revised metrics used by the current version of the website carbon calculator, but the percentage score is exactly the same as that for the COP26 website: worse than 94% of other websites tested. A very poor showing from a website advertising a summit on climate change.
As with my tests last year, I also ran the COP27 website through PingdomTools, which reported that the homepage has a total weight of over 11 MB; better than the 18 MB of the COP26 website, but still far worse than the current average of around 2.2 MB.
Once again this is a very disappointing result and, just like last year, a cursory examination of the website code reveals that performance was never a consideration. Almost 3 MB of Javascript and over 8 MB of images are not signs of a website optimised for performance.
We have the technology to drastically reduce the web's carbon emissions, but it is useless if we do not use it.